The Everything Code: Understanding the Macro-Crypto Connection
Explore how global liquidity, debt cycles, and fiat debasement connect all asset classes—from stocks to Bitcoin. A deep dive into the macro framework driving risk assets.
What You'll Learn
- Understand the thesis that liquidity drives all risk assets
- Learn the mechanism connecting fiat debasement to asset prices
- See how the debt cycle influences long-term market dynamics
- Recognize the framework's limitations and critiques
"The Everything Code" is a macro framework popularized by Raoul Pal (founder of Real Vision and Global Macro Investor) that argues all risk assets—stocks, crypto, commodities, real estate—are ultimately driven by the same force: global liquidity.
This article explores the core ideas, the evidence, and the implications for portfolio construction.
For a deeper dive into Raoul Pal's specific framework and methodology, see Raoul Pal's Liquidity Framework.
Core Thesis
The Everything Code framework rests on three pillars:
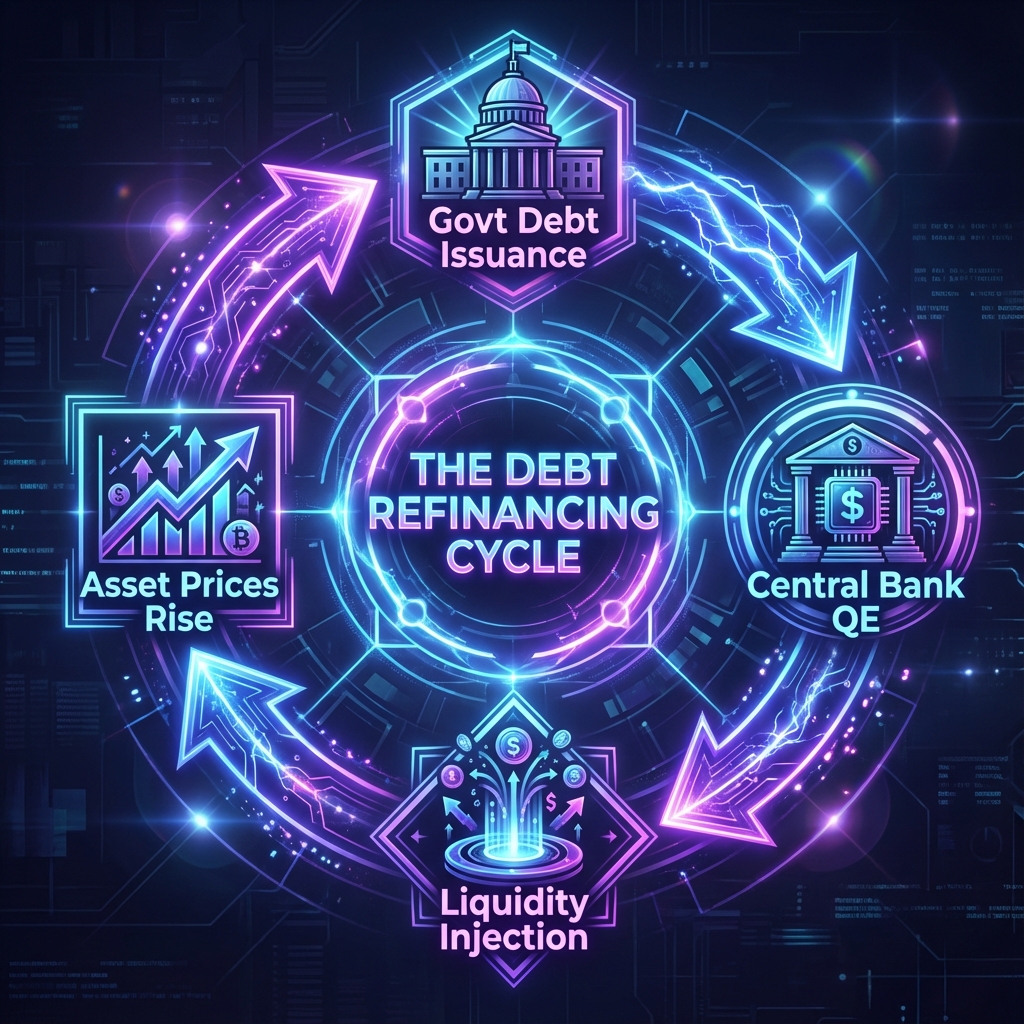
1. The Debt Refinancing Cycle
Post-2008, central banks engineered what some call a "perpetual debt jubilee":
- Governments issue debt — Running deficits to fund spending
- Central banks buy debt — Through QE, keeping rates artificially low
- Debt refinancing recurs — Proponents argue that it creates liquidity pulses, but the repository has not calibrated a fixed period
The proposed rhythm is a framework hypothesis. Its period and phase mapping must be estimated from a declared series and sample before it can be presented as an empirical result.
2. Liquidity as Master Variable
The framework argues that liquidity is a dominant driver of asset price levels (not a precise short-horizon return-forecasting signal).
Legacy exploratory scripts produced level-regression figures, but those results are not part of the canonical generated pipeline and are not published here as validated evidence. Regressing trending price levels on trending liquidity levels can create spurious fit. VantMacro therefore treats the framework as a hypothesis and liquidity as context, not a mechanical timing tool.
Key insight: Prices rise not primarily because of improving fundamentals, but because there's more money chasing the same assets.
3. Fiat Debasement
The framework defines a purchasing-power hurdle by combining a chosen liquidity-growth measure with a chosen inflation measure. VantMacro does not publish a fixed rate because the result is sensitive to currency, series, transform, aggregation, and sample window. A value must be generated from those declared inputs.
The Everything Connection
The framework explains why different asset classes move together:
Correlation During Liquidity Events
During major liquidity shocks, cross‑asset correlations often rise: many risk assets move together. High‑beta assets (tech, crypto) tend to swing more than broad equities, while defensive assets can behave differently depending on the shock (growth vs inflation vs policy).
Beta to Liquidity
Proponents assign different qualitative sensitivities to asset classes, but the canonical pipeline does not estimate liquidity betas. VantMacro therefore does not publish fixed multipliers here.
Evidence For the Framework
M2 and Asset Prices
VantMacro’s data supports a nuanced version of the liquidity thesis:
- Legacy level regressions are not canonical evidence because shared trends can create spurious fit.
- A replacement comparison must declare transformations, lags, vintage controls, and a reproducible evaluation design before any strength claim is published.
The 4-Year Cycle
Proponents often argue that liquidity cycles (and refinancing cycles) create a rhythm in risk assets. This is plausible as a narrative, but the strength of any “cycle” depends heavily on:
- the liquidity definition (M2 vs balance sheets vs net-liquidity adjustments),
- the lag choice,
- and the sample window.
Treat “cycle” claims as hypotheses to test, not as universal laws.
Criticisms and Nuances
1. Correlation ≠ Causation
Both liquidity and asset prices respond to economic conditions. The correlation could be spurious—both caused by a third factor.
2. The Debasement Rate Is Model-Dependent
Any estimate varies by:
- Time period measured
- Currency (USD, EUR, emerging markets)
- Definition of inflation
Different defensible definitions can produce materially different estimates.
3. Timing Remains Uncertain
Knowing liquidity is expanding doesn't tell you exactly when to buy or how much assets will rally. The framework provides direction, not timing.
4. Structural Change Risk
If central banks genuinely normalize policy (possible, though not currently happening), the framework may weaken.
Practical Application
Liquidity-regime context
The maintained product shows whether year-over-year liquidity growth is positive or negative and displays its computed magnitude. It does not map uncalibrated strength bands to portfolio allocations.
What to Track
- M2 YoY — The broadest money supply measure
- Fed Balance Sheet YoY — The Fed-specific liquidity
- Global Central Bank Liquidity — Fed + ECB + BoJ + PBoC combined
- Dollar (DXY) — Inverse proxy for global liquidity conditions
Signals to Watch For
| Signal | Implication |
|---|---|
| M2 YoY turning positive | Potential inflection to risk-on |
| M2 YoY turning negative | Potential inflection to risk-off |
| Fed + ECB + BoJ all easing | Maximum bullish signal |
| Fed + ECB + BoJ all tightening | Maximum bearish signal |
The Everything Code and Bitcoin
Bitcoin occupies a special place in this framework:
Why Extreme Beta?
- No cash flows to discount — Pure monetary asset
- Fixed supply — No inflation of supply to dilute holders
- Retail + institutional — Sensitive to both M2 and Fed actions
- 24/7 liquidity — Responds immediately to macro events
The "Debasement Hedge" Thesis
Framework proponents argue Bitcoin is the optimal asset for:
- Comparing returns with a declared, contemporaneous purchasing-power measure
- Benefiting from ongoing monetary expansion
- Providing asymmetric upside during liquidity expansions
Caveats
- Bitcoin has experienced severe historical drawdowns
- Regulatory risk remains material
- The thesis is unproven over full economic cycles
How VantMacro Uses This
VantMacro incorporates the framework while maintaining empirical rigor:
What We Track
- Money and policy liquidity separately — M2, central bank balance sheets, and net-liquidity drains
- Global central bank aggregate — Equal-weighted across available configured regions, with weights renormalized when a region is unavailable
- YoY changes — Direction matters more than absolute levels
What We Add
- Regime classification — Combining liquidity with growth and risk
- Generated regime context — 397 observed state changes in the current artifact, with classifier accuracy explicitly uncalibrated
- Educational context — Explaining the "why" alongside the data
What We Don't Claim
- A fixed debasement rate is canonical — We require declared inputs and a generated estimate
- Bitcoin will outperform — We show the framework; you make decisions
- Timing is possible — We provide context, not trading signals
Summary
The Everything Code framework argues:
- All risk assets float on liquidity — M2, Fed balance sheet, global central banks
- Debt cycles may create liquidity pulses — The timing remains a hypothesis to test
- Fiat purchasing power changes over time — The relevant hurdle depends on the selected data and method
- High-beta assets (crypto, tech) benefit most — When liquidity expands
- Correlations break in crises — Until central banks respond
Use it as a lens, not gospel. Combine with other frameworks and your own judgment.
Data Sources
- Primary framework sources: public “Everything Code” commentary (notably Raoul Pal and related macro strategists) describing liquidity-driven market dynamics.
- Empirical checks referenced use public macro/liquidity series (money supply, central bank balance sheets, liquidity drains) and public asset price history.
Methodology
- Treats liquidity as a slow-moving state variable and validates claims using long samples and multiple transformations (levels vs YoY/changes).
- Uses the generated timeline's median date as a descriptive stability split and cross-references liquidity signals with growth and risk dimensions; it is not an untouched holdout test.
Limitations
- Liquidity definitions vary widely; different composites, lags, and sample windows can flip conclusions.
- Levels-based correlations can be dominated by shared trends; high R² is not proof of causality or a trading edge.
- Framework alignment is probabilistic; it provides context, not precise return forecasts or timing signals.
Further Reading
- Raoul Pal's Liquidity Framework — The originator's detailed framework
- The Complete Guide to Global Liquidity — How to track liquidity
- Market Regimes Explained — Full regime classification
See the Framework on VantMacro
- Real-time M2 and Fed balance sheet tracking
- Global liquidity composite
- Regime classification with liquidity dimension
Investment Disclaimer
The information provided by VantMacro is for educational and informational purposes only and should not be construed as financial, investment, legal, or tax advice.
Not Financial Advice: VantMacro provides economic data, regime analysis, and historical performance metrics. We do not recommend specific securities, investment strategies, or portfolio allocations. All content is for general information and should not be relied upon for making investment decisions.
No Guarantees: Past regime performance does not guarantee future results. Markets are unpredictable, and economic regimes can change rapidly. Historical data may not be indicative of future performance.
Consult a Professional: Before making any investment decisions, you should consult with a qualified financial advisor who understands your individual circumstances, risk tolerance, and financial goals.
Risk Disclosure: All investments carry risk, including the potential loss of principal. You are solely responsible for any investment decisions you make.
For complete disclaimer and terms, see our Full Investment Disclaimer and Terms of Service.