Market Regimes Explained
Understand VantMacro's 7-state regime classification system and the generated evidence used to describe historical durations, transitions, and asset returns.
What You'll Learn
- Understand what market regimes are and why they matter
- Learn VantMacro's 7-state regime classification system
- See how different regimes produce different asset performance
- Know how to interpret the current regime for context
Markets don't move randomly. They cycle through distinct regimes—periods where growth, inflation, liquidity, and risk combine in recognizable patterns.
VantMacro's regime classification system identifies which regime we're in right now, based on real data. This guide explains how it works, what each regime means, and how historical performance has varied across them.

What is a Market Regime?
A market regime is a distinct macro-economic environment characterized by the combination of:
- Growth conditions — Is the economy expanding or contracting?
- Liquidity & policy stance — Are central banks easing, neutral, or tightening?
- Market risk appetite — Are investors risk-seeking or defensive?
Different regimes produce different market dynamics. Understanding the current regime helps you interpret market moves in context.
Why Regimes Matter
From the current generated regime-history artifact:
- Asset behavior differs by regime — Especially for equities and some risk assets (with important caveats below)
- Transitions have observable historical frequencies — Some state changes recur more often in the generated timeline, but that does not make them calibrated forecasts
- Context improves interpretation — Knowing “where we are” helps explain why markets behave the way they do
Important: Regime analysis provides context, not trading signals. Past regime performance doesn't guarantee future results.
Empirical Grounding (What We Measured)
VantMacro’s regime research is grounded in a daily historical replay of the classifier. From this replay we quantify:
- Durations — How long each regime tends to last (contiguous regime periods)
- Transitions — What regimes most often follow what (next-regime probabilities)
- Exploratory diagnostics — Whether mean daily returns differ across labels in a one-way ANOVA, with multiple-testing correction and explicit time-series limitations
- Temporal stability — How regime-conditioned return patterns compare on either side of the generated sample's median date
Generated sample
8,240 daily classifications from 2003-12-25 through 2026-07-16, forming 398 contiguous periods and 397observed state changes.
The generated tables below are the source of displayed values. Refreshing the provider snapshots and rerunning the canonical pipeline updates the tables and their sample labels together.
VantMacro's 3-Dimensional Classification
VantMacro classifies market conditions along three independent dimensions, then combines them into a composite regime.
Dimension 1: Real Cycle
What it measures: Growth and inflation dynamics (where are we in the business cycle?)
| State | Characteristics |
|---|---|
| Reflationary/Goldilocks | Growth improving, inflation low or falling |
| Inflationary Boom | Growth strong, inflation rising |
| Stagflationary Slowdown | Growth weakening, inflation sticky |
| Disinflationary Slowdown | Growth weak, inflation falling |
Key Indicators: Chicago Fed National Activity Index (CFNAI), Consumer Price Index (CPI) Year-over-Year, Purchasing Managers' Index (PMI) data
Dimension 2: Liquidity & Policy
What it measures: Central bank stance and money/credit conditions
| State | Characteristics |
|---|---|
| Easing | Real M2/Net Liquidity improving; dollar soft or policy easing |
| Neutral | Mixed signals; no clear direction |
| Tightening | Real M2/Net Liquidity contracting; dollar firm or policy restrictive |
Key Indicators: Real M2 Year-over-Year, Net Liquidity Year-over-Year (Fed - TGA - RRP), US Dollar Index (DXY) trend, policy stance
Dimension 3: Market Risk
What it measures: Current market stress and risk appetite
| State | Characteristics |
|---|---|
| Risk-On | Low VIX, tight credit spreads, trending equities |
| Neutral | Mixed signals |
| Risk-Off | High VIX, wide credit spreads, equity weakness |
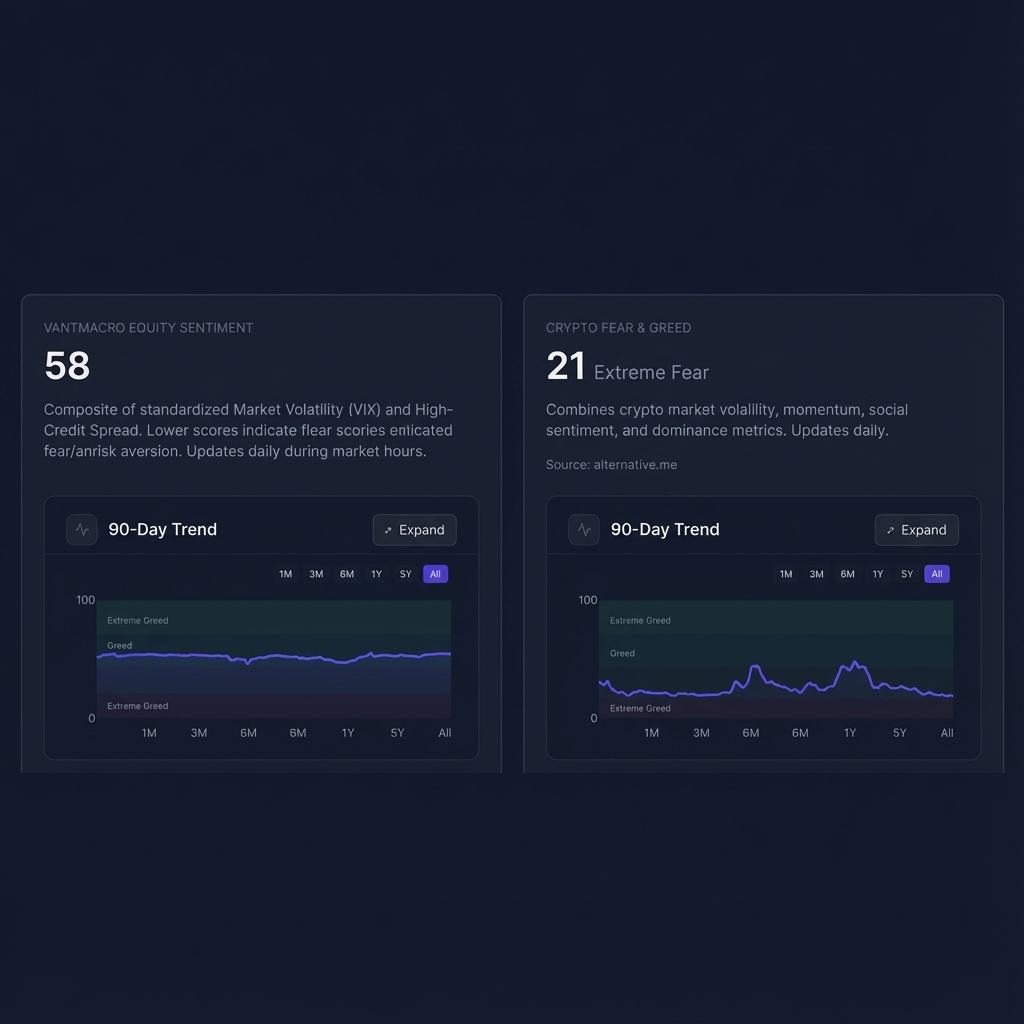
Key Indicators: Market Volatility (VIX), High-Yield Option-Adjusted Spread (OAS) — credit spreads, equity trend
The 7 Composite Regimes
VantMacro combines the three dimensions into 7 recognizable macro environments:
Generated Duration & Frequency
These are empirical statistics from the historical regime timeline (not estimates):
| Regime | Median | 25th–75th percentile | Periods | Days |
|---|---|---|---|---|
| Reflationary Expansion | 5 days | 2–13 days | 25 | 313 |
| Late-Cycle Inflationary Boom | 8 days | 5–21 days | 33 | 433 |
| Stagflationary Squeeze | 12 days | 3–25 days | 47 | 751 |
| Disinflationary Slowdown | 7 days | 5–25 days | 41 | 789 |
| Post-Shock Recovery | 6 days | 3–16 days | 83 | 1,388 |
| Crisis/Liquidation | 3 days | 1–10 days | 116 | 3,727 |
| Transitional | 9 days | 4–30 days | 53 | 839 |
Interpretation: This is a high-frequency regime model (days/weeks). It is not intended to label multi-year macro narratives.
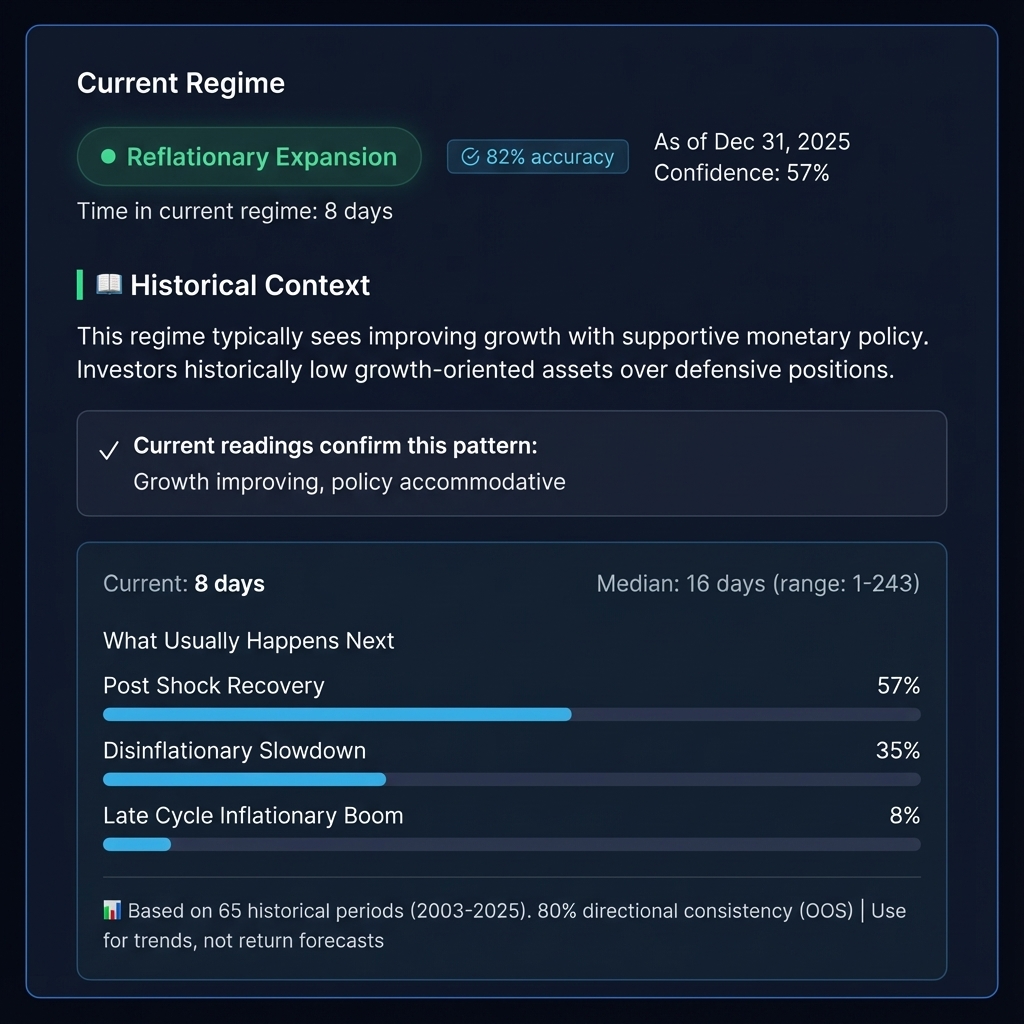
1. Reflationary Expansion
The sweet spot. Growth improving, policy supportive, risk appetite healthy.
- Typical conditions: Early-to-mid cycle expansion, falling inflation, accommodative policy
- Empirical note: Regimes are short-lived in the classifier output; treat this label as “current conditions”, not a forecast
2. Late-Cycle Inflationary Boom
Running hot. Strong growth with rising inflation pressures, policy beginning to tighten.
- Typical conditions: Peak cycle momentum, inflation accelerating, early tightening signals
- Empirical note: This regime often appears in short bursts around inflation surprises and policy repricing
3. Stagflationary Squeeze
The difficult environment. Growth weakening while inflation remains elevated—central banks in a bind.
- Typical conditions: Policy tightening into slowdown, supply shocks, cost-push inflation
- Empirical note: Longer median duration than other regimes, but still typically measured in weeks, not quarters
4. Disinflationary Slowdown
The soft landing attempt. Growth moderating with falling inflation—policy on hold or easing.
- Typical conditions: Late-cycle deceleration, inflation peaking, pre-recession nervousness
- Empirical note: This label is common in the history, frequently surrounding turning points and policy pivots
5. Post-Shock Recovery
The rebound phase. Aggressive policy support following a crisis, early signs of stabilization.
- Typical conditions: Post-crisis liquidity surge, emergency rate cuts, fiscal stimulus
- Generated context: The application lists the longest observed episodes directly from the current timeline rather than attaching hand-written event labels.
6. Crisis / Liquidation
Risk-off panic. Major financial stress, deteriorating growth, forced selling across asset classes.
- Typical conditions: Credit markets stressed, VIX above the documented operational high-stress cutoff, and growth conditions deteriorating
- Empirical note: The generated duration table reports the current range; no fixed “typical crisis length” is assumed.
7. Transitional
Unclear signals. Dimensions giving conflicting readings; market direction uncertain.
- Typical conditions: Data revisions, cross-currents between growth and policy, regional divergences
- Empirical note: Transitional is frequently brief because conflicting signals tend to resolve quickly into another state
How Regimes Transition
The table reports observed next-state frequencies from the current generated timeline. They are historical shares, not probabilities calibrated for today.
| From regime | Observed next state | Frequency |
|---|---|---|
| Reflationary Expansion | Post-Shock Recovery | 48% |
| Reflationary Expansion | Late-Cycle Inflationary Boom | 32% |
| Reflationary Expansion | Stagflationary Squeeze | 12% |
| Late-Cycle Inflationary Boom | Reflationary Expansion | 30.3% |
| Late-Cycle Inflationary Boom | Stagflationary Squeeze | 30.3% |
| Late-Cycle Inflationary Boom | Crisis/Liquidation | 18.2% |
| Stagflationary Squeeze | Crisis/Liquidation | 45.7% |
| Stagflationary Squeeze | Late-Cycle Inflationary Boom | 15.2% |
| Stagflationary Squeeze | Transitional | 15.2% |
| Disinflationary Slowdown | Crisis/Liquidation | 41.5% |
| Disinflationary Slowdown | Post-Shock Recovery | 29.3% |
| Disinflationary Slowdown | Transitional | 22% |
| Post-Shock Recovery | Crisis/Liquidation | 53% |
| Post-Shock Recovery | Disinflationary Slowdown | 13.3% |
| Post-Shock Recovery | Reflationary Expansion | 13.3% |
| Crisis/Liquidation | Post-Shock Recovery | 37.1% |
| Crisis/Liquidation | Transitional | 23.3% |
| Crisis/Liquidation | Disinflationary Slowdown | 17.2% |
| Transitional | Crisis/Liquidation | 52.8% |
| Transitional | Late-Cycle Inflationary Boom | 15.1% |
| Transitional | Disinflationary Slowdown | 13.2% |
Empirical Validation
VantMacro publishes descriptive backtests and exploratory diagnostics for the generated labels. Classifier accuracy is not calibrated because no independent ground-truth regime labels are available in this repository.
Generated sample
8,240 daily classifications from 2003-12-25 through 2026-07-16, forming 398 contiguous periods and 397observed state changes.
Key Findings
The one-way ANOVA is exploratory. Its raw and Benjamini–Hochberg-adjusted p-values and descriptive eta-squared values are generated together:
| Asset | Raw p | BH-adjusted p | Eta-squared | FDR flag |
|---|---|---|---|---|
| BTC | 0.167 | 1.00 | 0.0024 | No |
| CPER | 0.998 | 1.00 | 0.0001 | No |
| DXY | 0.681 | 1.00 | 0.0008 | No |
| EEM | 0.342 | 1.00 | 0.0020 | No |
| EPI | 0.928 | 1.00 | 0.0004 | No |
| ETH | 0.223 | 1.00 | 0.0023 | No |
| EWJ | 0.940 | 1.00 | 0.0004 | No |
| EWU | 0.980 | 1.00 | 0.0002 | No |
| FXI | 0.808 | 1.00 | 0.0006 | No |
| GLD | 0.783 | 1.00 | 0.0006 | No |
| IWM | 0.699 | 1.00 | 0.0008 | No |
| QQQ | 1.00 | 1.00 | 0.0000 | No |
| SLV | 0.871 | 1.00 | 0.0005 | No |
| SPX | 0.999 | 1.00 | 0.0001 | No |
| USO | 0.621 | 1.00 | 0.0009 | No |
| VGK | 0.996 | 1.00 | 0.0001 | No |
Persistent labels, serial dependence, heteroskedasticity, and endogenous market inputs prevent a confirmatory, causal, or predictive interpretation.
Temporal-Stability Check (Median-Date Split)
The generated median date divides the available sample into earlier and later eras, then compares regime-level annualized-return patterns. It is not an untouched holdout: the classifier rules were developed with knowledge of the full historical era.
| Asset | Regime-return correlation | Same-sign share |
|---|---|---|
| BTC | unavailable | unavailable |
| CPER | 0.363 | 33.3% |
| DXY | -0.159 | 66.7% |
| EEM | 0.275 | 66.7% |
| EPI | -0.621 | 33.3% |
| ETH | unavailable | unavailable |
| EWJ | -0.290 | 50% |
| EWU | -0.812 | 16.7% |
| FXI | -0.165 | 16.7% |
| GLD | 0.468 | 66.7% |
| IWM | -0.151 | 33.3% |
| QQQ | -0.614 | 66.7% |
| SLV | -0.457 | 50% |
| SPX | -0.705 | 66.7% |
| USO | -0.140 | 33.3% |
| VGK | -0.936 | 0% |
Limitations
- Sample size constraints: Some regimes (especially Crisis) have limited occurrences
- Look-ahead bias risk: All backtests are conducted on historical data; real-time classification may differ
- Changing dynamics: Regime relationships may shift over time due to structural changes (e.g., central bank communication, market structure)
How to Use Regime Analysis
As Context, Not Timing
Regime analysis tells you "where are we in the cycle?" not "what should I buy today?"
Good uses:
- Understanding why certain assets are outperforming or underperforming
- Identifying when conditions favor risk-taking vs. defensiveness
- Avoiding fighting the macro trend
- Framing portfolio construction decisions
Poor uses:
- Day-to-day timing decisions
- Ignoring other factors (valuations, positioning, earnings)
- Assuming future regimes will mirror past performance
Dashboard Integration
VantMacro's regime classification appears across the dashboard:
- Overview: Current operational regime shown with generated historical context; classifier accuracy is uncalibrated
- Liquidity: Feeds into the Liquidity & Policy dimension
- Indicators: Feeds into the Real Cycle dimension
- Risk & Sentiment: Feeds into the Market Risk dimension
- History: Compare current conditions to historical regime periods
Common Questions
"Why do some regimes last only a few days?"
Regimes represent distinct macro configurations, not calendar periods. The economy can shift quickly between states, especially during volatile periods. Short durations are common during transitions and crisis episodes.
"Can you predict regime changes?"
Not with precision. VantMacro tracks the indicators that historically precede transitions, but timing is inherently uncertain. The goal is awareness, not prediction.
"Why do Crisis regimes sometimes show positive average returns?"
Because the averages include recovery rallies that occur within the crisis classification period. The negative Sharpe ratios reveal the true picture: high volatility with unreliable outcomes.
"How does this differ from 'risk-on / risk-off'?"
Traditional risk-on/risk-off is a single dimension (market risk). VantMacro's 3-dimensional classification captures more nuance—you can have risk-on market behavior in a deteriorating macro environment, or risk-off behavior during an improving cycle.
Data Sources
- VantMacro dashboard methodology — /dashboard/methodology
- FRED series: CFNAI (
CFNAI) — https://fred.stlouisfed.org/series/CFNAI - FRED series: CPI (
CPIAUCSL) — https://fred.stlouisfed.org/series/CPIAUCSL - FRED series: VIX (
VIXCLS) — https://fred.stlouisfed.org/series/VIXCLS - FRED series: High Yield OAS (
BAMLH0A0HYM2) — https://fred.stlouisfed.org/series/BAMLH0A0HYM2 - FRED series: Fed Total Assets (
WALCL) — https://fred.stlouisfed.org/series/WALCL - FRED series: Treasury General Account (
WDTGAL) — https://fred.stlouisfed.org/series/WDTGAL - FRED series: Overnight Reverse Repo (
RRPONTSYD) — https://fred.stlouisfed.org/series/RRPONTSYD
Methodology
- Classifies regimes from three inputs: Real Cycle (growth/inflation), Liquidity & Policy, and Market Risk (stress/sentiment).
- Empirical summaries referenced here come from a daily historical replay of the classifier (regime periods, transitions, and asset behavior by regime).
- Recomputes the descriptive stability split at the generated timeline's median date; it is not an untouched trained-model validation.
Limitations
- Regime labels are model outputs; real-time classifications can differ from backfilled history due to data revisions, publication lags, and model updates.
- Many regimes are short-lived, which limits statistical power and makes annualized performance metrics unstable in small samples.
- Regime analysis provides context and risk framing, not precise timing signals or return forecasts.
Further Reading
- The Complete Guide to Global Liquidity — Deep dive on the Liquidity & Policy dimension
- Generated Regime Evidence — Detailed methods, generated tables, and limitations
Track Regimes on VantMacro
See the current operational regime classification with generated historical context:
- Real-time regime detection across 3 dimensions
- Generated descriptive performance data with sample counts
- Transition monitoring and alerts
Investment Disclaimer
The information provided by VantMacro is for educational and informational purposes only and should not be construed as financial, investment, legal, or tax advice.
Not Financial Advice: VantMacro provides economic data, regime analysis, and historical performance metrics. We do not recommend specific securities, investment strategies, or portfolio allocations. All content is for general information and should not be relied upon for making investment decisions.
No Guarantees: Past regime performance does not guarantee future results. Markets are unpredictable, and economic regimes can change rapidly. Historical data may not be indicative of future performance.
Consult a Professional: Before making any investment decisions, you should consult with a qualified financial advisor who understands your individual circumstances, risk tolerance, and financial goals.
Risk Disclosure: All investments carry risk, including the potential loss of principal. You are solely responsible for any investment decisions you make.
For complete disclaimer and terms, see our Full Investment Disclaimer and Terms of Service.