The Complete Guide to Global Liquidity
Learn how central bank policies, money supply, and net liquidity drive global markets. A practical guide to tracking the fuel that moves risk assets.
What You'll Learn
- Understand what global liquidity is and why it matters for markets
- Learn the key components: central bank balance sheets, M2, and net liquidity
- Know how to track liquidity using FRED data or VantMacro
- Recognize the limitations of liquidity-based analysis
Global liquidity is the fuel that drives financial markets. When central banks expand their balance sheets and money supply grows, asset prices tend to rise. When liquidity contracts, markets often struggle.
This guide explains what global liquidity is, how to measure it, and why it matters for investors—grounded in empirical data rather than speculation.
What is Global Liquidity?
Global liquidity refers to the total amount of money and credit available in the global financial system. It's shaped by:
- Central bank balance sheets — The assets held by the Federal Reserve, European Central Bank (ECB), Bank of Japan (BoJ), People's Bank of China (PBoC), and Bank of England (BoE)
- Money supply (M2) — The total amount of money circulating in the economy (cash, deposits, and liquid assets)
- Net liquidity adjustments — Government cash accounts and facilities that absorb or release money
Think of liquidity as the tide in financial markets. When the tide rises (liquidity expands), most boats (assets) rise with it. When the tide recedes (liquidity contracts), even good boats can struggle.
Why Does Liquidity Matter?
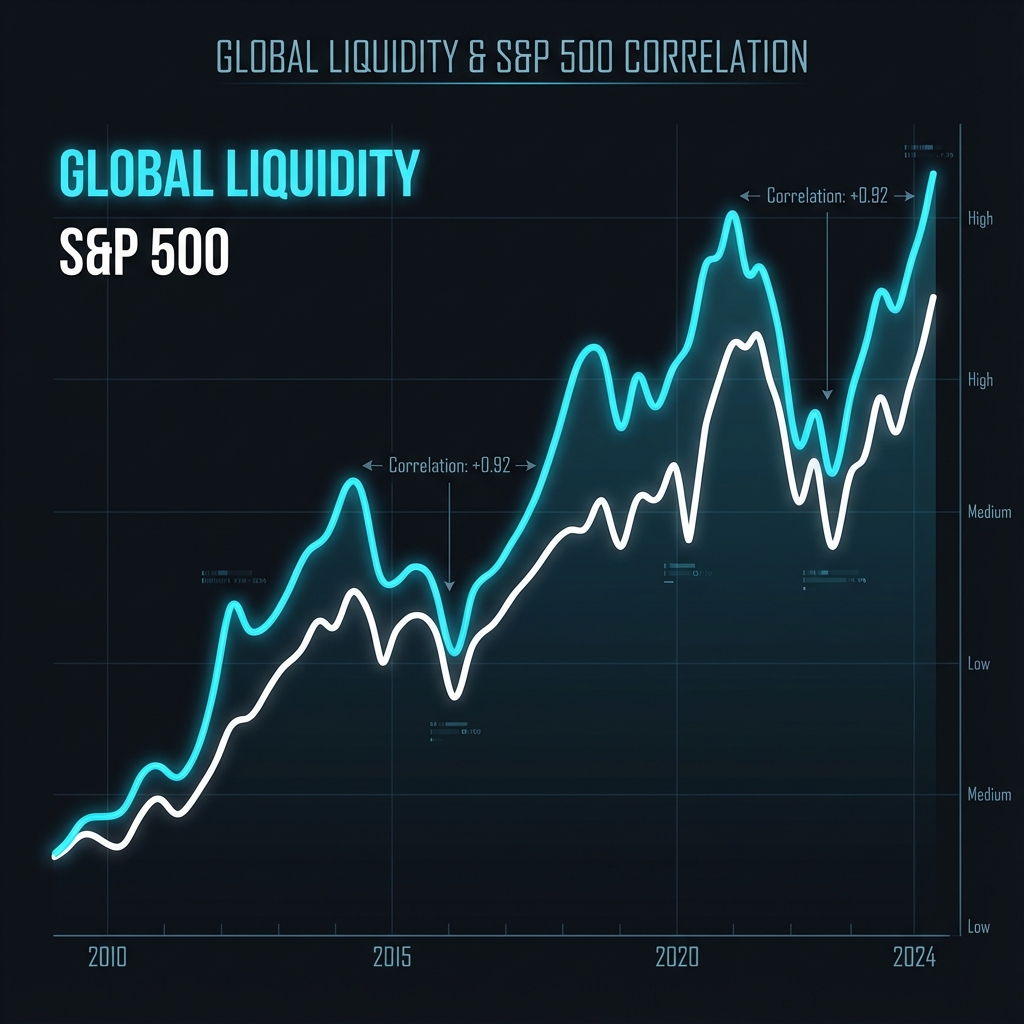
Historical analysis shows that changes in global liquidity correlate with risk asset performance—though this relationship is noisy and shouldn't be used for precise timing.
Working hypotheses to evaluate against the generated regime and return data:
- Expanding liquidity tends to create supportive conditions for equities, credit, and crypto
- Contracting liquidity often precedes or accompanies market stress
- Lead times vary — No universal lead is assumed; any lag must be declared and recomputed for the selected series and sample
Caveat: Correlation is not causation. Liquidity is one factor among many. It provides context, not trading signals.
Components of Global Liquidity
Global liquidity combines regional central-bank and money-supply pulses. The current VantMacro dashboard takes an equal-weight mean across the available regions and renormalizes when a region is missing. It does not claim GDP weights.
Regional inputs
| Region | Current primary measures |
|---|---|
| United States (Fed) | Net Liquidity (WALCL - TGA - RRP) |
| China (PBoC) | M2 Money Supply |
| Eurozone (ECB) | ECB Assets + Euro Area M2 |
| Japan (BoJ) | BoJ Assets + M2 |
| United Kingdom (BoE) | BoE Assets + M4 |
Each available row receives 1 / number of available rows in the displayed
composite. That weight is computed at runtime rather than copied into this page.
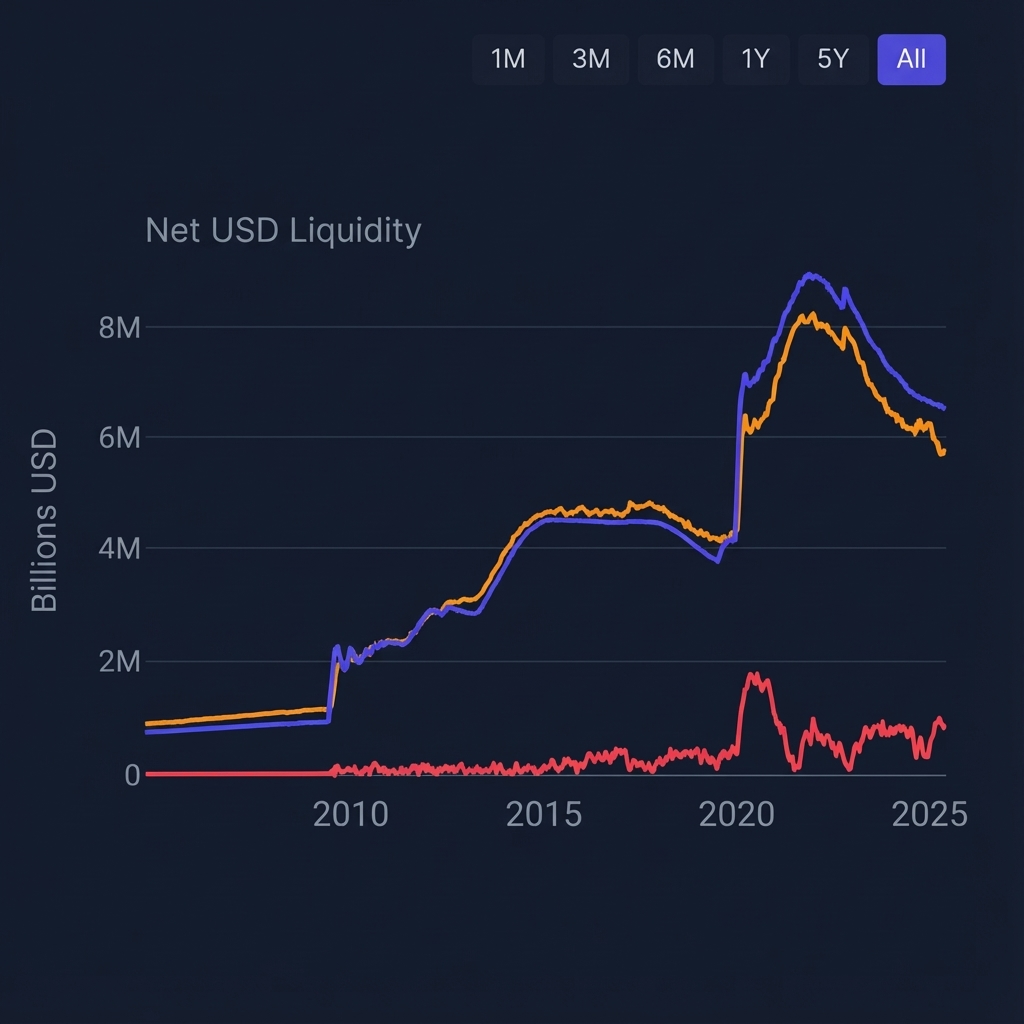
US: Federal Reserve
The US series is shown separately because the net-liquidity construction includes the Treasury General Account and reverse-repo facility.
Key FRED Series:
WALCL— Federal Reserve Total Assets (Balance Sheet)WDTGAL— Treasury General Account (TGA) — The government's checking account at the FedRRPONTSYD— Overnight Reverse Repurchase Agreement (RRP) — Money "parked" at the Fed by money market funds
Net Liquidity Formula:
Net Liquidity = Fed Assets (WALCL) - TGA (WDTGAL) - RRP (RRPONTSYD)
When the Fed expands its balance sheet through quantitative easing (QE), liquidity increases. When the Treasury builds up its cash balance (TGA rises) or money moves into the reverse repo facility (RRP rises), effective liquidity decreases—even if the Fed's total balance sheet hasn't changed.
Eurozone: European Central Bank
The ECB's contribution combines:
- ECB balance sheet assets — Sovereign bonds purchased through quantitative easing (QE) programs
- Euro Area M2 — Broad money supply in the eurozone
VantMacro tracks year-over-year (YoY) changes in both measures to gauge whether the ECB is adding or withdrawing liquidity.
China: People's Bank of China
China is unique because PBoC balance sheet data is difficult to interpret directly. Instead, VantMacro focuses on:
- China M2 growth — The primary measure of Chinese liquidity expansion
- Credit impulse — The rate of change in new credit (monitored qualitatively)
China's M2 often moves independently of Western central banks, which can create divergences in global liquidity conditions.
Japan: Bank of Japan
The BoJ has maintained the largest balance sheet relative to Gross Domestic Product (GDP) of any major central bank due to decades of yield curve control and QE. VantMacro tracks:
- BoJ assets year-over-year (YoY)
- Japan M2 year-over-year (YoY)
Japan's contribution is smaller in absolute terms, but its extreme monetary policy can influence yen carry trades and global risk appetite.
United Kingdom: Bank of England
The BoE's contribution is relatively small due to the UK's smaller economic footprint. VantMacro tracks:
- BoE assets year-over-year (YoY)
- UK M4 (broad money) year-over-year (YoY)
How Global Liquidity Affects Markets
The Mechanism
Liquidity affects markets through multiple channels:
- Portfolio rebalancing — When central banks buy bonds, sellers reinvest proceeds into riskier assets
- Credit availability — More liquidity means banks can lend more easily
- Risk appetite — Abundant liquidity reduces funding stress and encourages risk-taking
- Currency effects — Aggressive monetary expansion can weaken a currency, affecting international capital flows
Operational interpretation
The maintained rule uses the sign of year-over-year change: positive is labelled expanding, zero is the neutral boundary, and negative is labelled contracting. No generated study currently calibrates additional strength bands or maps them to future asset outcomes.
Limitations of the Liquidity-Price Correlation
It's tempting to assume "liquidity up = stocks up." This is an oversimplification:
- Timing is imprecise — Liquidity leads markets, but the lag varies from months to quarters
- Other factors matter — Earnings, geopolitics, and positioning can overwhelm liquidity effects short-term
- Diminishing returns — The marginal impact of liquidity changes depends on starting conditions
- Correlation ≠ causation — Both liquidity and asset prices can respond to a third factor (e.g., economic shocks)
How to Track Global Liquidity
For a complete step-by-step tutorial, see How to Track Global Liquidity: Step-by-Step Guide →
DIY Approach: FRED Data
You can build a basic liquidity tracker using free FRED data:
US Net Liquidity:
- Go to FRED
- Download series:
WALCL,WDTGAL,RRPONTSYD - Calculate:
Net Liquidity = WALCL - WDTGAL - RRPONTSYD - Convert to billions if needed (TGA and RRP are in millions)
Real M2:
- Download:
M2SL(M2 Money Stock) andCPIAUCSL(Consumer Price Index) - Calculate:
Real M2 = (M2SL / CPIAUCSL) × 100 - Compute year-over-year (YoY) change to see the growth rate
Limitations of DIY:
- Requires manual updates
- Global data (ECB, BoJ, PBoC) requires multiple sources
- No composite weighting or visualization
VantMacro's Liquidity Dashboard
VantMacro consolidates all of this into a single real-time view:
- US Liquidity Regime — Real M2 and Net Liquidity with YoY changes
- Global Liquidity Pulse — Equal-weight mean across available Fed, ECB, BoJ, PBoC, and BoE regional pulses
- Dollar (DXY) — A proxy for global financial conditions
- Liquidity vs S&P 500 — Rolling correlation analysis
The dashboard is designed for interpretation, not trading signals—helping you understand whether liquidity is a tailwind, headwind, or neutral backdrop.
View the Liquidity Dashboard →
Global Liquidity and Market Regimes
Liquidity is one of four dimensions VantMacro uses to classify market regimes:
| Dimension | Primary Indicator | What It Measures |
|---|---|---|
| Growth | Chicago Fed National Activity Index (CFNAI) | Economic activity |
| Inflation | Consumer Price Index (CPI) Year-over-Year | Price pressures |
| Liquidity | Real M2, Net Liquidity, US Dollar Index (DXY) | Money and credit conditions |
| Risk | Market Volatility (VIX), High-Yield Credit Spreads | Market stress |
How Liquidity Feeds Into Regime Classification
The Liquidity & Policy dimension can be:
- Easing — Real M2/Net Liquidity improving; dollar soft or policy easing
- Neutral — Mixed signals; no clear direction
- Tightening — Real M2/Net Liquidity contracting; dollar firm or policy restrictive
This feeds into VantMacro's 7 composite regimes, each with distinct historical asset performance patterns.
Learn more: Market Regimes Explained →
Common Misconceptions
"Liquidity Predicts Everything"
Reality:
Key Takeaway: Liquidity isn't just about printing money. It's about how much money is available to buy assets relative to the supply of assets.
 Earnings disappointments, geopolitical shocks, and positioning extremes can overwhelm liquidity effects.
"QE = Instant Stock Rally"
Reality: QE announcements often coincide with stock rallies, but the relationship is complex. Sometimes markets have already priced in expected QE, or the QE is insufficient relative to economic damage.
"Central Bank Balance Sheet = Available Liquidity"
Reality: Not all balance sheet expansion reaches markets immediately. The TGA and RRP adjustments matter because they show how much of the Fed's assets actually translate to spendable liquidity.
"Global Liquidity Is a Fixed Formula"
Reality: There's no universally agreed formula. VantMacro currently uses an equal-weight mean across available configured regions and renormalizes missing rows. Other methods use economic weights or additional credit metrics. Transparency about methodology matters more than claiming the "right" formula.
Practical Takeaways
- Use liquidity as context, not timing — It helps you understand whether conditions favor risk-taking, not when to buy or sell
- Track year-over-year changes, not absolute levels — The direction and rate of change matter more than the number itself
- Combine with other signals — Cross-reference liquidity with growth indicators, risk metrics, and valuations
- Expect lag uncertainty and noise — Any lag must be estimated for the declared series and sample
- Stay humble — Past correlations don't guarantee future performance
Data Sources
- FRED (St. Louis Fed) for U.S. liquidity plumbing series (e.g.,
WALCL,WDTGAL,RRPONTSYD) and monetary aggregates (e.g.,M2SL). - Central bank statistical releases for balance sheets and money supply (Fed, ECB, BoJ, PBoC, BoE).
- National statistics releases for inflation series used when discussing “real” measures.
Methodology
- Defines “global liquidity” as an equal-weight mean across available configured regional balance-sheet and broad-money pulses, with missing rows renormalized.
- Uses U.S. “net liquidity” as a practical U.S. component lens: Fed assets minus TGA minus RRP.
- Interprets the metric via YoY/trend changes (often with lags) rather than as a short-horizon timing signal.
Limitations
- There is no single, universally agreed definition of global liquidity; weights and series choices materially change results.
- Cross-country comparability is imperfect (currency conversion, reporting frequency, and structural breaks over time).
- Liquidity is a macro backdrop variable; correlations are unstable and do not imply causality.
Further Reading
Related VantMacro Articles
- What is Net Liquidity? — Deep dive on the Fed balance sheet formula
- Market Regimes Explained — How liquidity fits into regime classification
External Resources
- FRED Database — Federal Reserve Economic Data
- ECB Statistical Data Warehouse — Eurozone monetary data
- Bank of Japan Statistics — Japanese central bank data
Track Global Liquidity on VantMacro
See how liquidity conditions are shaping markets right now:
- Real-time Net Liquidity and Real M2 tracking
- Global central bank pulse (Fed, ECB, BoJ, PBoC, BoE)
- Correlation analysis with S&P 500
- Integration with regime classification
Explore the Liquidity Dashboard →
Investment Disclaimer
The information provided by VantMacro is for educational and informational purposes only and should not be construed as financial, investment, legal, or tax advice.
Not Financial Advice: VantMacro provides economic data, regime analysis, and historical performance metrics. We do not recommend specific securities, investment strategies, or portfolio allocations. All content is for general information and should not be relied upon for making investment decisions.
No Guarantees: Past regime performance does not guarantee future results. Markets are unpredictable, and economic regimes can change rapidly. Historical data may not be indicative of future performance.
Consult a Professional: Before making any investment decisions, you should consult with a qualified financial advisor who understands your individual circumstances, risk tolerance, and financial goals.
Risk Disclosure: All investments carry risk, including the potential loss of principal. You are solely responsible for any investment decisions you make.
For complete disclaimer and terms, see our Full Investment Disclaimer and Terms of Service.