Understanding Business Cycles
Learn how business cycles work—from expansion to recession and back. A practical guide to tracking growth, inflation, and the four seasons of the economic cycle.
What You'll Learn
- Understand the phases of a business cycle
- Learn the 4 Seasons framework for classifying cycle phases
- Know which indicators track business cycle position
- Recognize how different assets perform in each phase
The business cycle is the heartbeat of the economy. Understanding where we are in the cycle helps explain why certain assets outperform, why policy changes, and what might come next.
This guide explains how business cycles work, how to track them, and how VantMacro'We use a "4 Seasons" framework to classify these phases. Just as winter reliably follows autumn, economic slowdowns reliably follow booms.
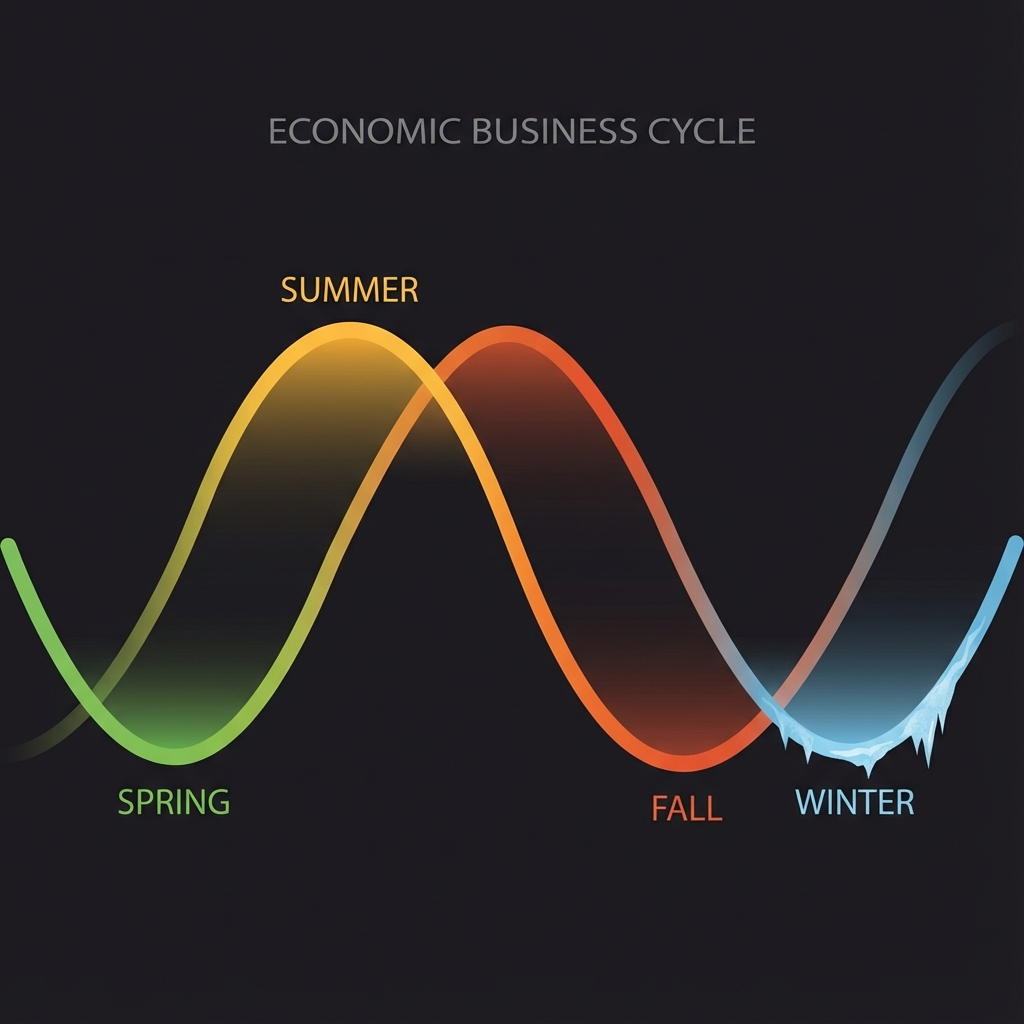
The Four Seasons
What is a Business Cycle?
A business cycle is the recurring pattern of expansion and contraction in economic activity. It's characterized by:
- Expansion: GDP growing, unemployment falling, confidence rising
- Peak: Maximum output before the slowdown begins
- Contraction: Growth slowing or negative, layoffs increasing
- Trough: The bottom—lowest point before recovery begins
- Recovery: Growth resuming, leading back to expansion
Cycles don't run on fixed schedules. Expansions can last 2-10+ years; contractions typically last 6-18 months.
The Four Season Framework
VantMacro uses a "seasonal" metaphor—popularized by macro strategist Julien Bittel (Global Macro Investor / Real Vision)—to classify business cycle phases:
Spring: Early Recovery
Economic profile:
- Growth accelerating from trough
- Inflation low or falling
- Policy accommodative
- Confidence rebuilding
Typical conditions:
- Chicago Fed National Activity Index (CFNAI) rising from negative territory
- Consumer Price Index year-over-year below 2-3%
- Fed funds rate low or being cut
Asset implications (historical):
- Equities tend to rally strongly
- Cyclicals and small caps often outperform
- Credit spreads compress
- Duration underperforms as yields stabilize
Summer: Mid-Cycle Expansion
Economic profile:
- Growth above trend
- Inflation rising but controlled
- Policy neutral to slightly tightening
- Confidence high
Typical conditions:
- CFNAI solidly positive (>0.5)
- CPI YoY 2-4%
- Fed in "data-dependent" mode
Asset implications (historical):
- Equities positive but more selective
- Commodities benefit from strong demand
- Quality/value rotation possible
- Duration neutral
Fall: Late-Cycle Deceleration
Economic profile:
- Growth slowing from peak
- Inflation sticky or elevated
- Policy tightening
- Confidence beginning to waver
Typical conditions:
- CFNAI falling from peak
- CPI YoY above 3-4%
- Fed funds rate rising or high
Asset implications (historical):
- Equity returns compress; volatility rises
- Defensives and quality outperform
- Duration becomes attractive as rate hikes peak
- Gold often performs well
Winter: Recession
Economic profile:
- Growth contracting
- Inflation falling (demand destruction)
- Policy pivoting to emergency mode
- Confidence low
Typical conditions:
- CFNAI below the disclosed operational weak-growth rule (-0.22)
- Yield curve re-steepening
- Fed cutting aggressively
Asset implications (historical):
- Equities decline; cash outperforms
- Duration rallies as rates fall
- Credit spreads widen sharply
- Quality premium highest
Key Indicators: CFNAI
VantMacro primarily uses the Chicago Fed National Activity Index (CFNAI) to track business cycle conditions.
What is CFNAI?
CFNAI is a weighted average of 85 existing monthly indicators of national economic activity. It's constructed so that:
- CFNAI = 0 = Economy growing at historical trend
- CFNAI > 0 = Above-trend growth
- CFNAI < 0 = Below-trend growth
VantMacro Thresholds
| CFNAI Level | Operational interpretation |
|---|---|
| Above 0.12 | Strong-growth label |
| 0 to 0.12 | Above-trend label |
| -0.22 to 0 | Below-trend label |
| Below -0.22 | Weak-growth label |
These are generated distributional boundaries with recorded sample and input provenance, not fitted recession probabilities.
Why CFNAI Over GDP?
- Timeliness: CFNAI is released monthly; GDP is quarterly with revisions
- Breadth: 85 indicators vs. one composite number
- Real-time: Less revision-prone than GDP
- Momentum capture: Shows direction, not just level
FRED series: CFNAI (Chicago Fed National Activity Index)
Inflation: The Other Axis
Business cycle seasons depend on both growth and inflation. Two economies with the same growth rate can be in different seasons if inflation differs.
VantMacro Inflation Thresholds
| CPI YoY Level | Classification |
|---|---|
| Below 1.8% | Lower historical distribution |
| Between the generated boundaries | Intermediate historical distribution |
| Above 2.9% | Upper historical distribution |
The boundaries are recomputed from the canonical availability-lagged CPI sample on each empirical refresh. They describe the observed distribution and do not estimate recession odds or an optimal policy target.
Inflation Slope Matters Too
- Rising inflation suggests late-cycle pressures
- Falling inflation suggests demand weakness or successful policy tightening
- Stable inflation is typically mid-cycle
The Season Matrix
VantMacro classifies seasons using a 2x2 matrix (simplified):
| Inflation Low/Falling | Inflation Elevated/Rising | |
|---|---|---|
| Growth Rising | Spring | Summer |
| Growth Falling | Winter (if severe) | Fall |
The actual classification includes more nuance:
- Growth state: Above trend / Near trend / Below trend
- Growth slope: Rising / Stable / Falling
- Inflation state: Low / Normal / Elevated / High
- Inflation slope: Rising / Stable / Falling
How Seasons Relate to Regimes
VantMacro's Business Cycle Seasons and Composite Regimes are complementary frameworks:
| Framework | Focus | Time Frame |
|---|---|---|
| Seasons | Growth + Inflation dynamics | Medium-term (months) |
| Regimes | Growth + Liquidity + Risk | Short-term (days-weeks) |
Mapping (approximate):
| Season | Typical Regimes |
|---|---|
| Spring | Reflationary Expansion, Post-Shock Recovery |
| Summer | Late-Cycle Inflationary Boom |
| Fall | Stagflationary Squeeze, Disinflationary Slowdown |
| Winter | Crisis/Liquidation, Transitional |
Learn more: Market Regimes Explained →
Tracking the Cycle Yourself
Key Data Sources
| Indicator | Source | Frequency | What It Shows |
|---|---|---|---|
| CFNAI | Chicago Fed (FRED) | Monthly | Growth vs. trend |
| ISM Manufacturing PMI | ISM | Monthly | Factory activity |
| ISM Services PMI | ISM | Monthly | Services activity |
| CPI YoY | BLS (FRED) | Monthly | Inflation level |
| Unemployment Rate | BLS (FRED) | Monthly | Labor market slack |
| Yield Curve (10Y-2Y) | FRED | Daily | Recession signal |
Simple Framework
- Check CFNAI: Above or below trend?
- Check CPI YoY: Inflation high or low?
- Check momentum: Are both rising or falling?
- Combine: Which season fits?
VantMacro Dashboard
VantMacro automates this with:
- Real-time season classification
- Growth and inflation gauges
- Historical season comparison
- Integration with regime detection
Common Questions
"How long do cycles last?"
It varies enormously:
- Expansions: 58 months average (post-WWII), but ranged from 12 to 128 months
- Contractions: 11 months average, but ranged from 2 to 18 months
The 2009-2020 expansion lasted 128 months—the longest on record.
"Can we predict recessions?"
Not precisely. Leading indicators (yield curve, credit spreads, CFNAI trend) can signal elevated risk, but timing is unreliable. VantMacro focuses on identifying current conditions, not predicting the future.
"Why use seasons instead of expansion/contraction?"
The four-season framework captures more nuance:
- Expansion can be "spring" (early, disinflationary) or "summer" (mature, inflationary)
- Late cycle isn't recession but isn't healthy expansion either
- It aligns naturally with asset allocation frameworks
"Is CFNAI better than PMI?"
They're complementary:
- CFNAI: Broader (85 indicators), less revision-prone, better for regime classification
- PMI: More timely (first business day of month), forward-looking (new orders)
Practical Takeaways
- Know your season — Spring favors risk; Winter favors safety
- Track Chicago Fed National Activity Index (CFNAI) monthly — It's the best single indicator of cycle position
- Watch inflation direction — Not just level, but whether it's rising or falling
- Combine with liquidity — Seasons tell you about the economy; liquidity tells you about markets
- Don't time the turn — Recognize when conditions have shifted, don't predict when they will
Data Sources
- NBER: US business cycle dating — https://www.nber.org/research/business-cycle-dating
- Chicago Fed: CFNAI overview — https://www.chicagofed.org/publications/cfnai/index
- FRED series: CFNAI — https://fred.stlouisfed.org/series/CFNAI
- FRED series: CPI (
CPIAUCSL) — https://fred.stlouisfed.org/series/CPIAUCSL
Methodology
- Uses a seasonal “growth × inflation” lens (Spring/Summer/Fall/Winter) to describe where the economy is within the cycle.
- Treats CFNAI as a broad, composite growth proxy and CPI YoY as a practical inflation proxy for discussing cycle dynamics.
- Uses NBER recession dates as an ex-post reference point, not as a real-time timing model.
Limitations
- Cycle labels are simplifications; transitions are messy and mixed signals are common.
- CFNAI and inflation data are released with lags and can be revised, so real-time inference differs from backfilled history.
- The framework is descriptive context, not a forecasting guarantee or investment advice.
Further Reading
- Market Regimes Explained — How cycles feed into regime classification
- CFNAI vs PMI — Comparing growth indicators
- The Complete Guide to Global Liquidity — The other half of regime analysis
Track Business Cycles on VantMacro
- Real-time season classification with growth/inflation breakdown
- CFNAI tracking with historical context
- Integration with regime and liquidity analysis
Investment Disclaimer
The information provided by VantMacro is for educational and informational purposes only and should not be construed as financial, investment, legal, or tax advice.
Not Financial Advice: VantMacro provides economic data, regime analysis, and historical performance metrics. We do not recommend specific securities, investment strategies, or portfolio allocations. All content is for general information and should not be relied upon for making investment decisions.
No Guarantees: Past regime performance does not guarantee future results. Markets are unpredictable, and economic regimes can change rapidly. Historical data may not be indicative of future performance.
Consult a Professional: Before making any investment decisions, you should consult with a qualified financial advisor who understands your individual circumstances, risk tolerance, and financial goals.
Risk Disclosure: All investments carry risk, including the potential loss of principal. You are solely responsible for any investment decisions you make.
For complete disclaimer and terms, see our Full Investment Disclaimer and Terms of Service.