How to Track Global Liquidity: Step-by-Step Guide
Learn exactly how to track global liquidity using free FRED data or VantMacro. Step-by-step instructions for calculating net liquidity and Real M2.
What You'll Learn
- Download and organize FRED data for liquidity tracking
- Calculate US Net Liquidity from Fed balance sheet data
- Compute Real M2 to measure inflation-adjusted money supply
- Interpret liquidity metrics using empirical thresholds
Many investors hear about "liquidity driving markets" but don't know where to start tracking it themselves. This guide gives you the exact steps to build your own liquidity tracker using free government data—or to skip the manual work entirely with VantMacro.
What you'll learn:
- How to download the right FRED series for liquidity tracking
- How to calculate US Net Liquidity (Fed Assets − TGA − RRP)
- How to compute Real M2 (inflation-adjusted money supply)
- How to interpret your results using empirical thresholds
Time required: 30-45 minutes (DIY) or instant (VantMacro) Difficulty: Beginner Prerequisites: Spreadsheet software (Excel, Google Sheets) or VantMacro account
Prerequisites
Before you begin, make sure you have:
- A FRED account (free at fred.stlouisfed.org)
- Spreadsheet software (Excel, Google Sheets, or similar)
- Basic comfort with formulas and date alignment
If you want to skip the manual process entirely, VantMacro's Liquidity Dashboard calculates everything automatically with daily updates.
Step 1: Download FRED Data
The Federal Reserve Economic Data (FRED) database is your primary source for US liquidity data. You'll need five series:
Required Series
| Series ID | Name | Frequency | Units | Purpose |
|---|---|---|---|---|
WALCL | Fed Total Assets | Weekly | Millions | Fed balance sheet size |
WDTGAL | Treasury General Account | Weekly | Millions | Government cash at the Fed |
RRPONTSYD | Overnight Reverse Repo | Daily | Billions | Money parked at Fed by MMFs |
M2SL | M2 Money Stock | Monthly | Billions | Broad money supply |
CPIAUCSL | Consumer Price Index | Monthly | Index | For inflation adjustment |
How to Download
- Go to fred.stlouisfed.org
- Search for each series ID (e.g., "WALCL")
- Click Download → Excel or CSV
- Select the longest shared date range supported by every included series
- Repeat for all five series
Pro tip: Use FRED's "Edit Graph" feature to download multiple series at once. Add all series to a single graph, then download as a combined file.
Expected Result
You should have files containing:
- Weekly Fed balance-sheet observations (WALCL); use the provider metadata for the available date range
- Weekly TGA data (WDTGAL)
- Daily RRP data (RRPONTSYD)—you'll need to convert this to weekly
- Monthly M2 and CPI data
Important Caveat
Unit mismatch alert: WALCL and WDTGAL are in millions, but RRPONTSYD is in billions. You must multiply RRP by 1,000 before subtracting, or you'll get wildly wrong results.
Step 2: Calculate Net Liquidity
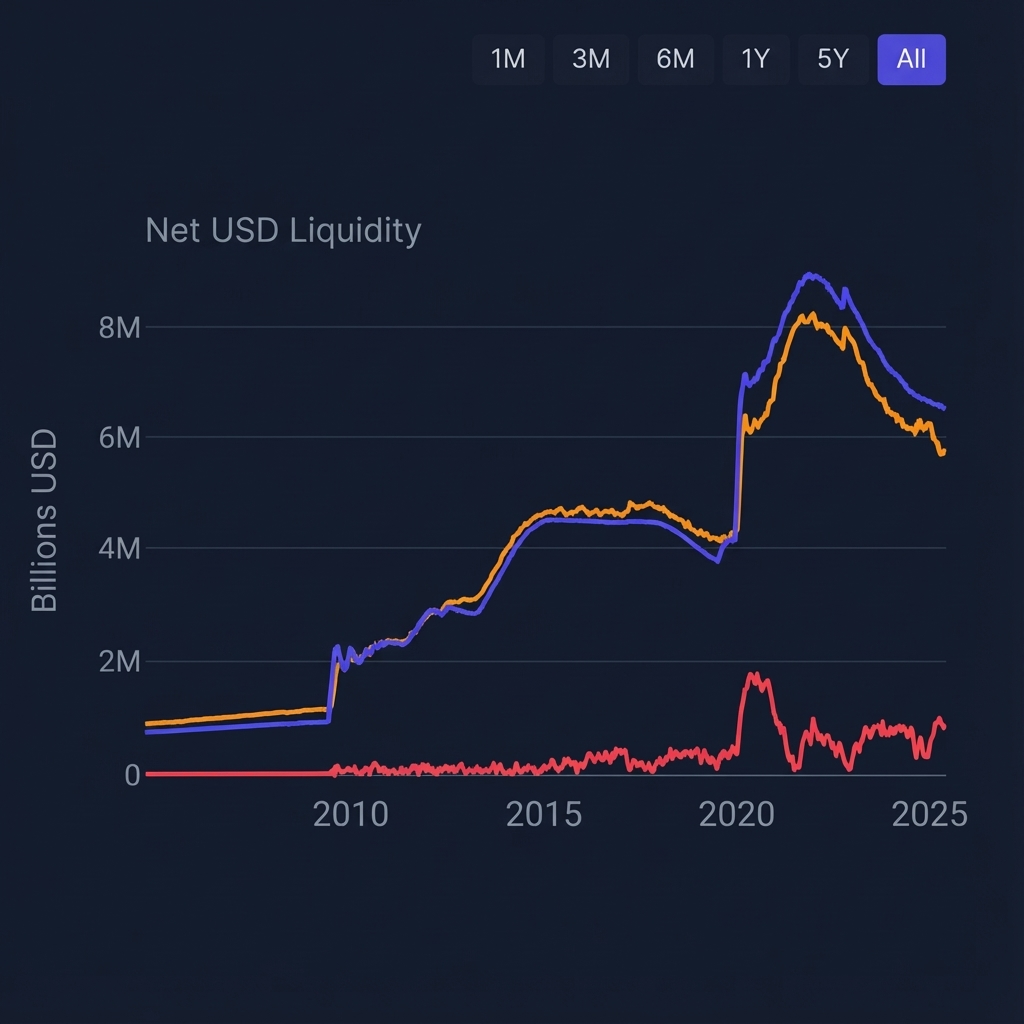
Net Liquidity measures how much of the Fed's balance sheet is actually available to financial markets—not locked up in government accounts.
The Formula
Net Liquidity = WALCL − WDTGAL − (RRPONTSYD × 1000)
All values should be in millions of dollars.
Step-by-Step in a Spreadsheet
-
Create a master date column — Use weekly dates (Wednesdays match FRED's release schedule)
-
Import your data — Paste WALCL and WDTGAL in adjacent columns
-
Handle RRP frequency mismatch:
- RRP is daily; WALCL/TGA are weekly
- Take the Wednesday value (or last available value before Wednesday)
- Multiply by 1,000 to convert billions → millions
-
Calculate Net Liquidity:
= WALCL - WDTGAL - (RRPONTSYD * 1000) -
Calculate Year-over-Year (YoY) change:
= (Current Net Liquidity - Net Liquidity 52 weeks ago) / Net Liquidity 52 weeks ago
Example Calculation
| Date | WALCL (M) | WDTGAL (M) | RRP (B) | RRP (M) | Net Liquidity |
|---|---|---|---|---|---|
| 2024-01-03 | 7,700,000 | 750,000 | 680 | 680,000 | 6,270,000 |
| 2024-01-10 | 7,680,000 | 780,000 | 650 | 650,000 | 6,250,000 |
Expected result: Net Liquidity values in the trillions (displayed as millions in the spreadsheet, so ~6,000,000 = $6 trillion).
Step 3: Calculate Real M2
Real M2 adjusts the money supply for inflation, showing whether purchasing power is actually expanding or contracting.
The Formula
Real M2 = (M2SL / CPIAUCSL) × 100
Then calculate Year-over-Year change:
Real M2 YoY = (Real M2 current - Real M2 12 months ago) / Real M2 12 months ago × 100
Step-by-Step
-
Align dates — Both M2 and CPI are monthly; align them by month
-
Calculate Real M2:
= (M2SL / CPIAUCSL) * 100 -
Calculate YoY growth rate:
= ((Real M2 current / Real M2 12 months ago) - 1) * 100
Why Real M2 Matters
Nominal M2 can increase while Real M2 decreases if inflation is rising faster than the money supply. Real M2 is what matters for purchasing power and liquidity conditions.
Example:
- M2 grows 5% nominally
- Inflation is 7%
- Real M2 is contracting by ~2%
This is a tightening signal even though nominal money supply increased.
Step 4: Interpret Your Results
Raw numbers don't mean much without context. VantMacro currently uses a documented definitional zero-crossing for year-over-year liquidity growth. It is a sign boundary, not a fitted empirical threshold.
Net Liquidity Interpretation
| YoY Change | Operational Signal | Interpretation |
|---|---|---|
| Positive | Expanding | Directional liquidity backdrop; magnitude is shown without an invented strength band |
| Zero | Neutral boundary | Definitional point with no directional change |
| Negative | Contracting | Directional liquidity headwind; not a calibrated market forecast |
Real M2 Interpretation
Use the same disclosed zero-crossing convention for direction: positive growth, zero boundary, or contraction. Show the magnitude, but do not assign an invented strength label or asset-return implication.
Key Point
The zero crossing is an operational convention, not a calibrated empirical threshold. A different banding scheme requires a versioned calibration study.
Critical Limitations
Your DIY tracker has important blind spots:
- US-only view — You are missing the separately measured ECB, BoJ, PBoC, and BoE regions
- Manual updates required — FRED data needs regular downloading
- No composite method — A composite requires a disclosed alignment and weighting rule
- Uncertain lag — The maintained pipeline does not publish a universal liquidity lead
Step 5: Automate with VantMacro
If you want real-time tracking without the spreadsheet maintenance, VantMacro's Liquidity Dashboard does everything above automatically:
What you get:
- US Net Liquidity — Daily calculation with YoY change
- Real M2 — Monthly with YoY growth rate
- Global Liquidity Pulse — Equal-weight mean across available Fed, ECB, BoJ, PBoC, and BoE regional pulses
- S&P 500 Correlation — Rolling correlation analysis
- Regime Integration — Liquidity feeds into the 7-state composite regime classification
Explore the Liquidity Dashboard →
Common Mistakes to Avoid
Mistake 1: Forgetting Unit Conversion
❌ Problem: Subtracting RRP (in billions) directly from WALCL (in millions) ✅ Solution: Always multiply RRP by 1,000 before subtracting
Mistake 2: Using Nominal Instead of Real M2
❌ Problem: Tracking M2 without adjusting for inflation ✅ Solution: Divide M2 by CPI to get purchasing-power-adjusted figures
Mistake 3: Expecting Immediate Market Correlation
❌ Problem: Assuming liquidity changes mean instant market moves ✅ Solution: Liquidity is a medium-term backdrop (months to quarters), not a day-trading signal
Mistake 4: Ignoring Global Liquidity
❌ Problem: Only tracking US data when markets are global ✅ Solution: Treat the US tracker as one regional input and inspect the other regions separately; do not assign it an unsupported fixed global share.
Mistake 5: Treating Levels as Signals
❌ Problem: Saying "Net Liquidity is $6 trillion—that's high!" ✅ Solution: Focus on the direction and rate of change (YoY), not absolute levels
Verification Checklist
How to verify your calculations are correct:
-
Net Liquidity identity check:
- Recalculate the value directly from aligned WALCL, WDTGAL, and converted RRP observations
- Confirm every displayed date maps to the intended source dates and units
-
Real M2 identity check:
- Recalculate the deflated level and year-over-year change from aligned source observations
- Confirm missing months and revisions are handled explicitly rather than filled silently
-
Cross-reference with VantMacro:
- Compare your DIY calculations to the dashboard
- Small differences are normal due to data vintage and calculation timing
Summary
You've learned how to track global liquidity yourself. Here's what we covered:
- Download FRED data — Five series: WALCL, WDTGAL, RRPONTSYD, M2SL, CPIAUCSL
- Calculate Net Liquidity — Fed Assets minus TGA minus RRP (watch the units!)
- Calculate Real M2 — M2 divided by CPI, then compute YoY change
- Interpret results — Use the disclosed zero-crossing and show the computed magnitude
- Consider automation — VantMacro handles all of this plus global data
Key takeaway: Liquidity tracking is accessible to anyone with a spreadsheet. But the real value comes from consistency, global coverage, and integration with other macro signals—which is what VantMacro provides.
Data Sources
- WALCL — Federal Reserve Total Assets
- WDTGAL — Treasury General Account
- RRPONTSYD — Overnight Reverse Repo
- M2SL — M2 Money Stock
- CPIAUCSL — Consumer Price Index
Methodology
- Calculates US Net Liquidity as
WALCL - WDTGAL - (RRPONTSYD × 1000)with unit normalization to millions of dollars. - Real M2 computed as
(M2SL / CPIAUCSL) × 100with YoY percentage change for trend analysis. - Interpretation uses a documented operational zero-crossing rule pending a reproducible calibration study.
Limitations
- This guide covers US liquidity only; the application’s global table currently equal-weights available configured regions and renormalizes when data are missing.
- FRED data has publication lags (typically 1-7 days depending on series).
- Liquidity-market correlations are unstable across regimes and do not imply causation.
- Not investment advice; use liquidity metrics as context, not timing signals.
Further Reading
- The Complete Guide to Global Liquidity — Understand what global liquidity is and why it matters
- What is Net Liquidity? — Deep dive on the Fed balance sheet formula
- What is Real M2? — Understanding inflation-adjusted money supply
Track Liquidity on VantMacro
Skip the spreadsheets and get real-time liquidity tracking:
- Daily Net Liquidity and Real M2 with YoY changes
- Global Liquidity Pulse across 5 central banks
- Correlation analysis with S&P 500
- Integration with regime classification
Explore the Liquidity Dashboard →
Investment Disclaimer
The information provided by VantMacro is for educational and informational purposes only and should not be construed as financial, investment, legal, or tax advice.
Not Financial Advice: VantMacro provides economic data, regime analysis, and historical performance metrics. We do not recommend specific securities, investment strategies, or portfolio allocations. All content is for general information and should not be relied upon for making investment decisions.
No Guarantees: Past regime performance does not guarantee future results. Markets are unpredictable, and economic regimes can change rapidly. Historical data may not be indicative of future performance.
Consult a Professional: Before making any investment decisions, you should consult with a qualified financial advisor who understands your individual circumstances, risk tolerance, and financial goals.
Risk Disclosure: All investments carry risk, including the potential loss of principal. You are solely responsible for any investment decisions you make.
For complete disclaimer and terms, see our Full Investment Disclaimer and Terms of Service.